
Unified Data Platform
Consolidate data from multiple sources into a single source of truth for improved visibility and governance.

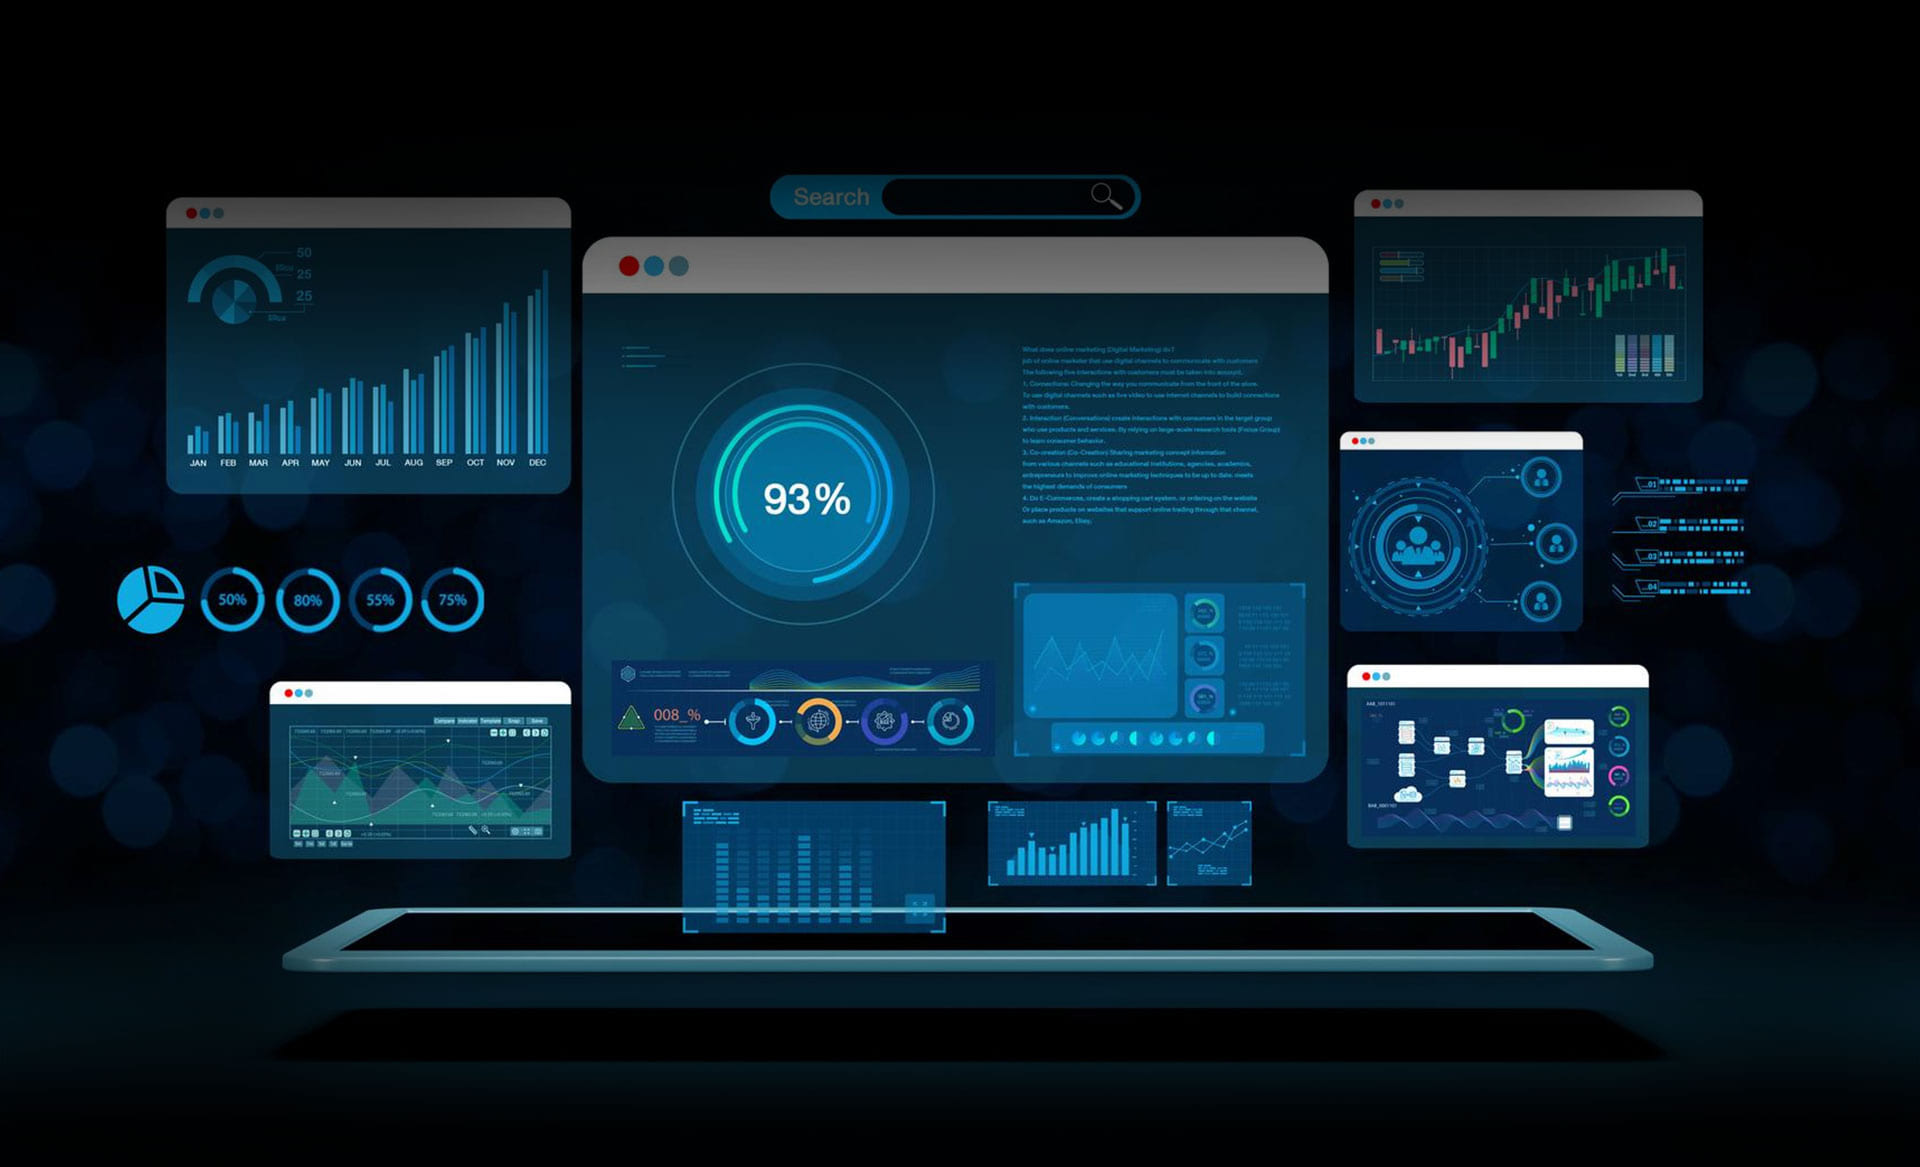
Turn disconnected data into a trusted foundation for reporting, analytics and strategic decision-making.
Many organisations struggle with fragmented data, manual reporting and limited visibility into business performance. Infront helps businesses consolidate data from multiple sources into a unified analytics platform, enabling real-time reporting, interactive dashboards and actionable insights.
By combining data engineering, business intelligence, analytics, dashboarding and automation, we help organisations improve operational efficiency, uncover growth opportunities and make decisions with confidence.
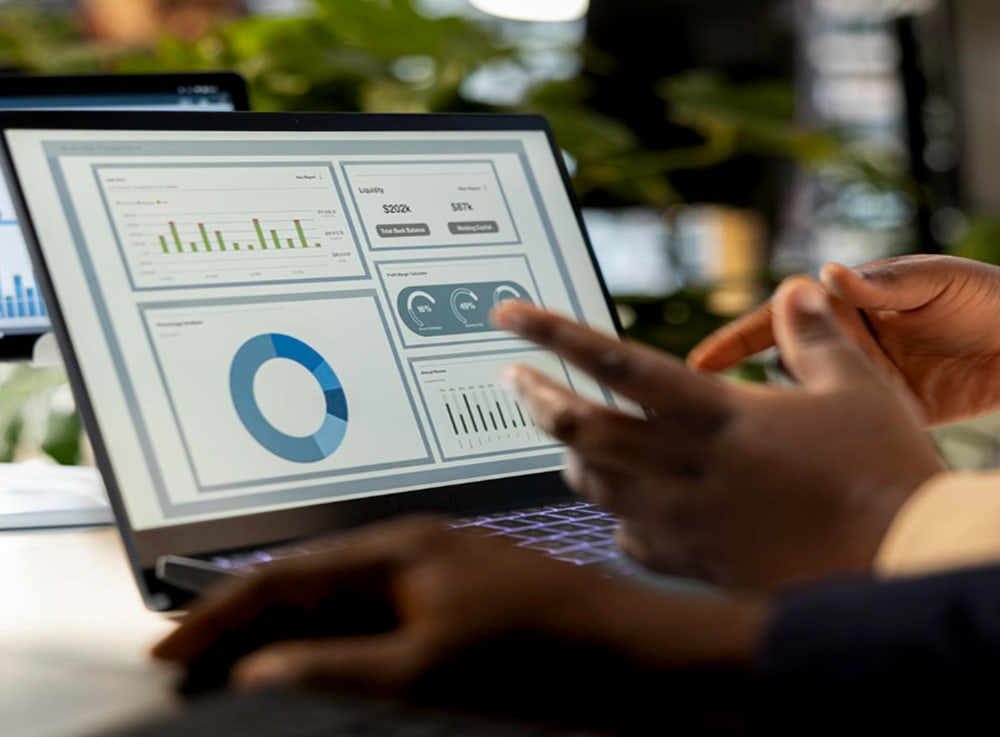
Access critical business information through centralised dashboards and real-time reporting across departments and systems.
Make informed business decisions using accurate, timely and actionable insights.
Reduce manual reporting efforts and streamline business processes through automated analytics and reporting.
Track business performance through measurable KPIs, trends and interactive dashboards tailored to your objectives.
Helping organisations unlock the full value of their data through analytics, dashboarding and business intelligence solutions.
Consolidate data from multiple sources into a single source of truth for improved visibility and governance.

Transform complex data into meaningful insights that support operational improvements and business growth.

Build dashboards tailored to your industry, business requirements and key performance indicators.

Leverage Infront’s expertise in Data Management & Engineering, BI & Analytics, AI/ML, Dashboarding, and Integration & Automation to maximise the value of your data investments.
Real Dashboards. Real Business Outcomes.
From sales performance and operational efficiency to healthcare insights, we develop analytics and dashboard solutions designed around industry-specific requirements and business objectives.
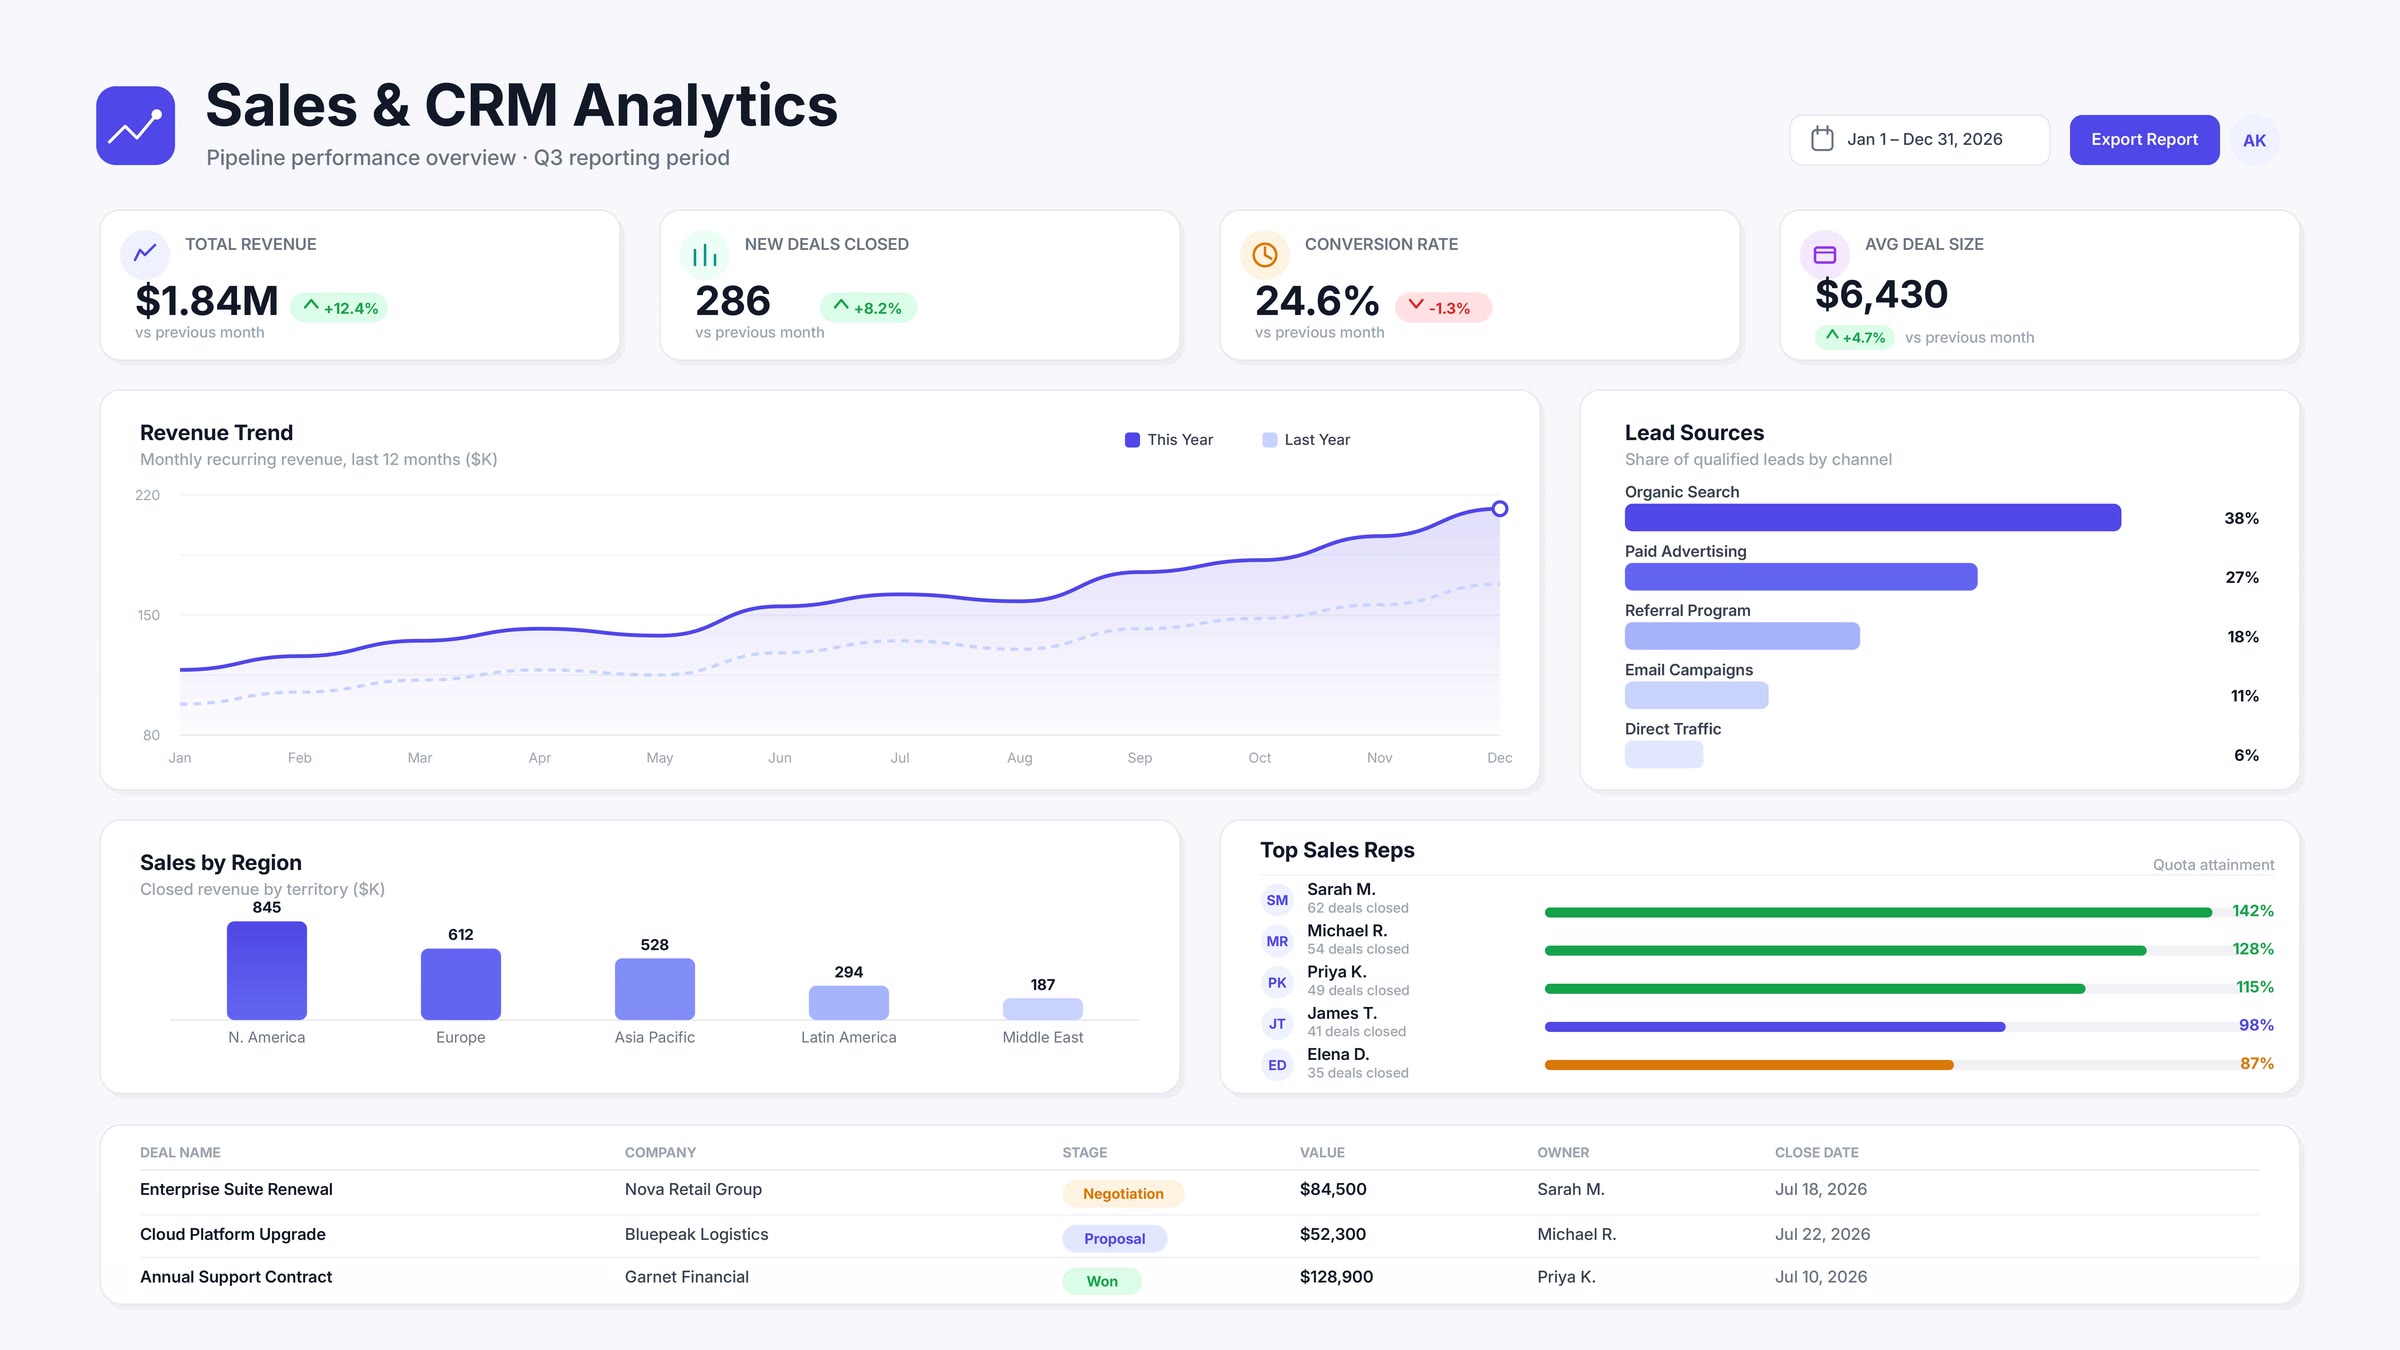
Monitor revenue trends, product performance and sales KPIs through real-time insights that support growth and improve forecasting.
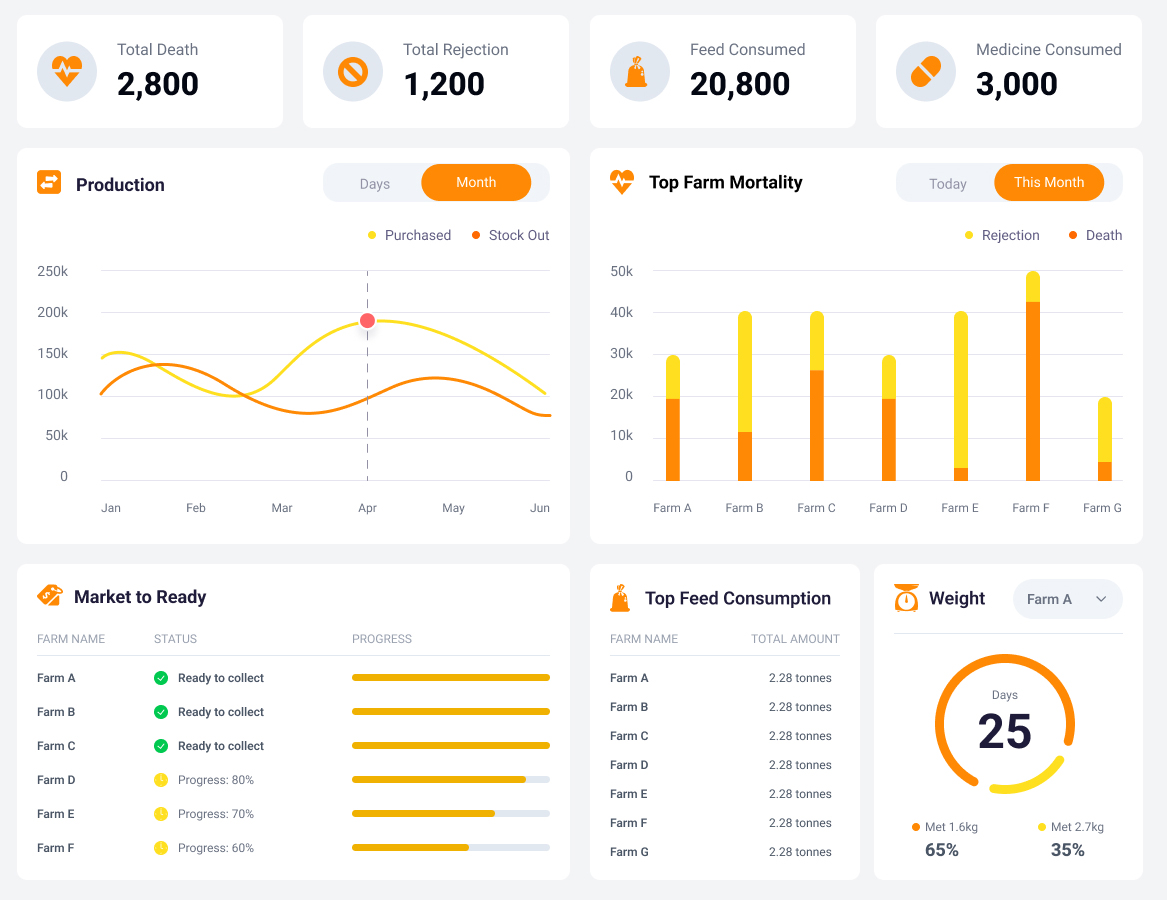
Track operational performance, identify inefficiencies and improve productivity through centralised reporting and analytics.
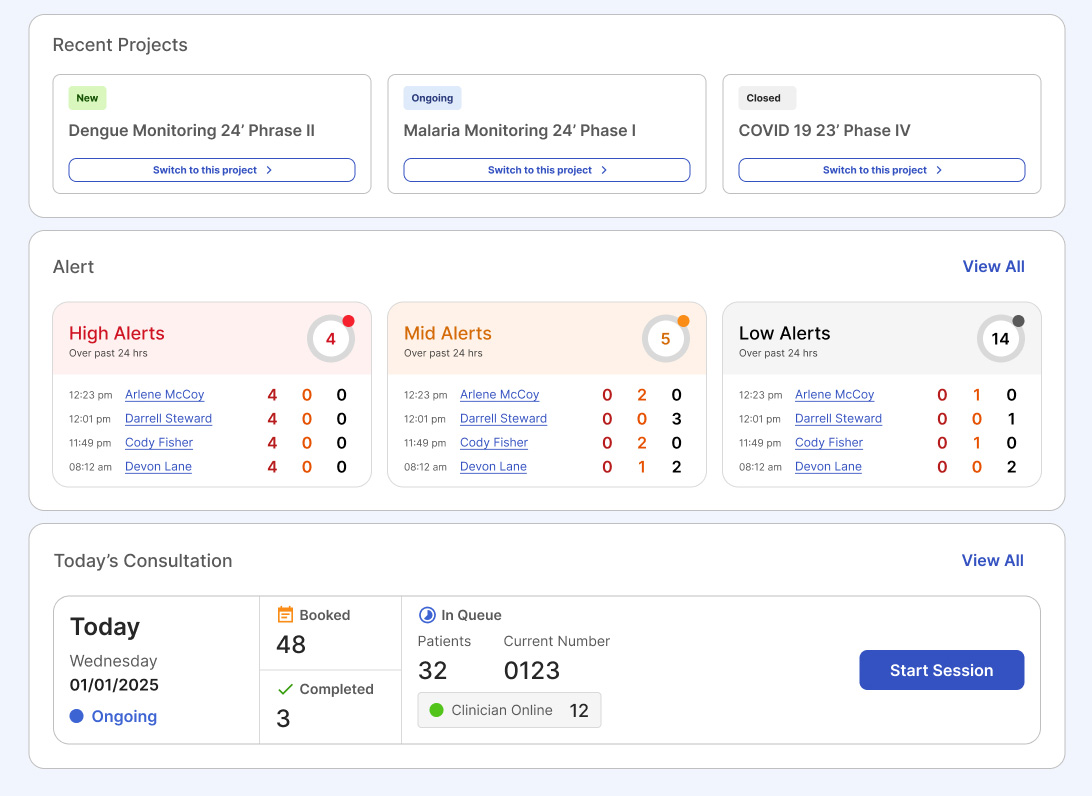
Visualise critical operational and healthcare data to support planning, reporting and informed decision-making.
Discover how analytics and dashboards can help your organisation improve visibility, optimise performance and uncover new growth opportunities.